Craig Kelly has published another post suggesting that a cooler February than last year indicates “global cooling”.
Claim
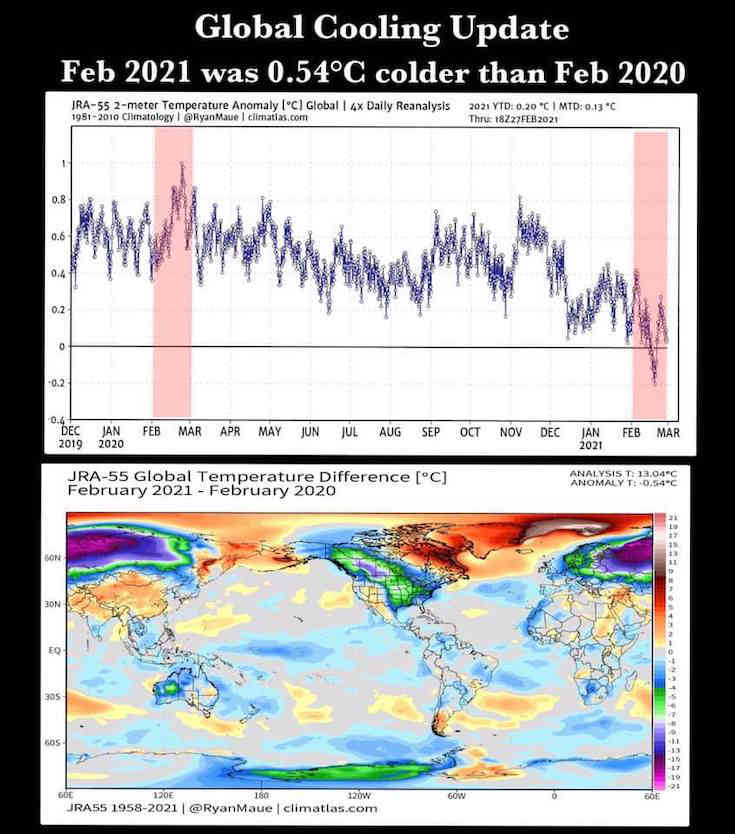
On March 4, Craig Kelly posted a graph of the last 15 months of global temperature data under the heading “Global cooling update”. He noted that the February 2021 temperature was 0.54°C cooler than February 2020.
Does the temperature record indicate global cooling?
Verdict

The claim is nonsense. Monthly temperatures rise and fall but an individual rise or fall doesn’t make a warming or cooling trend. Looking at the data in three different ways all show that the world is warming.
Analysis
It is easy to see why this claim is inane. Here are three quick analyses.
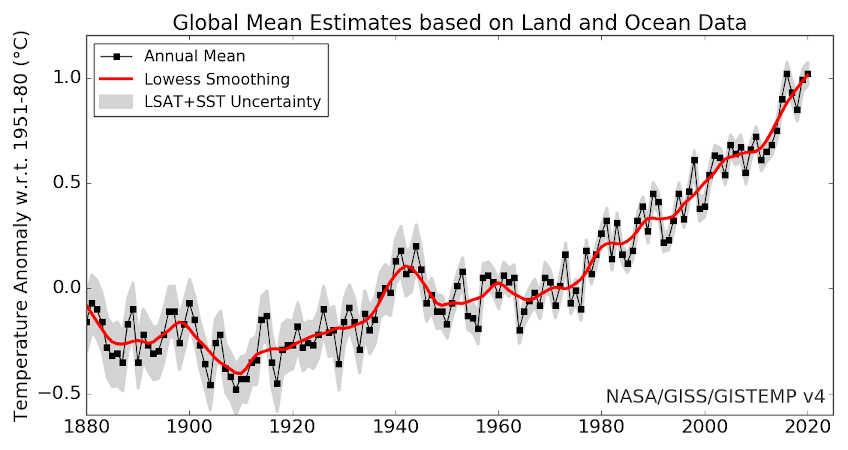
1. Long term annual temperature
Here is the annual temperature record since 1880 (from NASA). It is obvious the temperature fluctuates from year to year, but the rising trend is clear. Selecting one year where the temperature is lower than the previous year and proclaiming “global cooling” is foolish and doesn’t honestly reflect the data.
2. Monthly temperatures since 2000
Here is the monthly data since 2000 (from NASA). Again it is clear that the monthly temperatures fluctuate even more than the annual ones do (as you’d expect because of the seasons). But the rising trend is still quite clear.
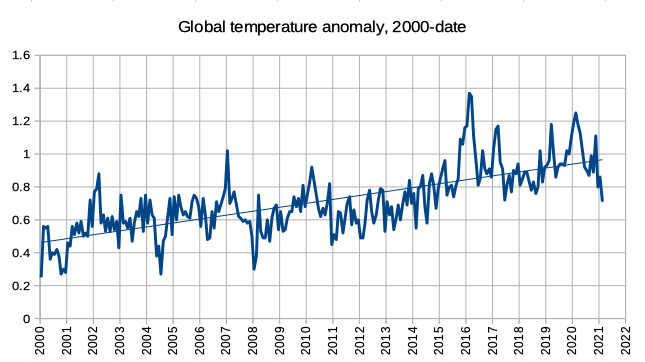
We can see five clear facts from the graph:
- February 2021 (along with December 2020 and January 2021) are all indeed cooler than the corresponding months a year before.
- Similar drops in temperature have occurred many times before, for example, in 2007, 2010, 2016 and 2017.
- Between January 2019 and June 2020 all months were hotter than the corresponding month a year earlier.
- Significant rises in temperature also occur throughout this record, for example, in 2001, 2006, 2015 and 2019.
- In all this, the overall trend is rising.
3. Comparing months a year apart
I have compared all the months in this 20 year NASA record with the same month a year before, the same comparison as Mr Kelly has used. I found that:
- 56% of months were hotter than the same month the year before;
- 41% of months were cooler than the same month the year before; and
- 3% of months were the same temperature.
So, more often than not, months are hotter than the corresponding month a year before.
Thus we can see that Mr Kelly could choose roughly 5 months in every year to make his incorrect point, and 6-7 months each year to show the opposite. He only chooses the ones that suit his purpose, but never the majority that don’t suit his purpose!
This shows that his claim is incorrect and nonsensical.
The source of this “information”
In this case, the information comes from Ryan Maue, a meteorologist who worked for the Cato Institute, a conservative “think tank” established by climate change denying billionaire fossil fuel advocates, the Koch brothers. The Institute has admitted on at least one occasion of using false data. In 2019 it closed its “Center for the Study of Science”, whose aim has been described as “to raise uncertainty about climate science”.
Dr Maue was appointed by former President Trump as chief scientist in the National Oceanic and Atmospheric Administration (NOAA) just prior to the recent Presidential election, but it appears he will not remain in this role.
The use of Dr Maue’s misleading data continues Mr Kelly’s preference for false “facts” from known vested interests while ignoring the vast amount of reliable data.